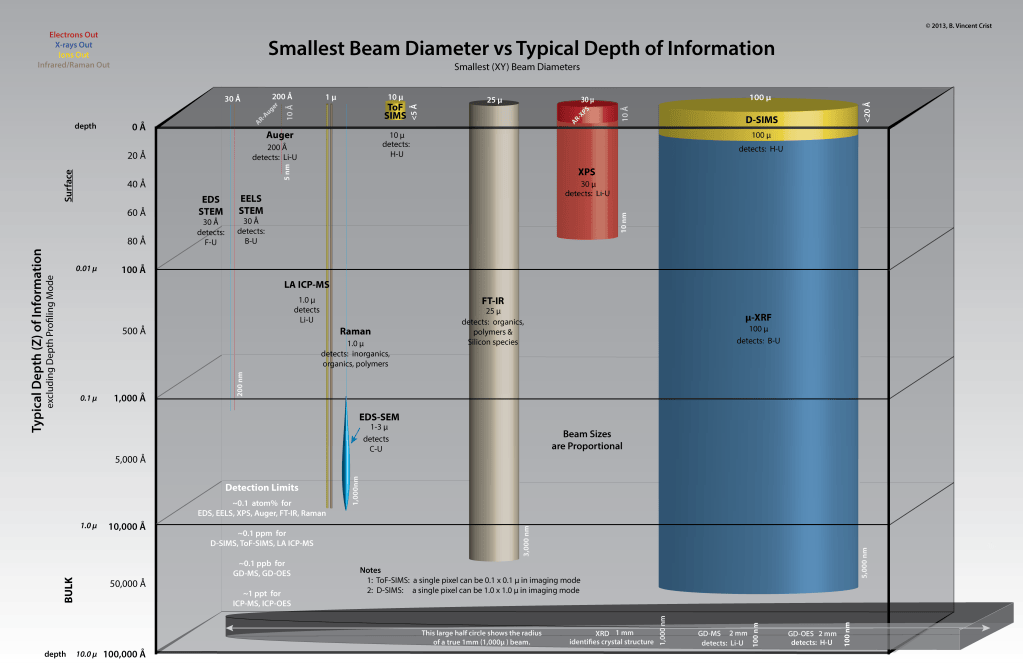
Depth of Information (Information Depth) is the depth from which useful information is obtained. For XPS, the depth is 90 degrees to or “normal” to the plane of the surface. When the sample is tilted then the depth of information decreases as a function of that angle. For XPS the depth of information ranges from 1 to 12 nm. Compare this miniscule depth to the Aluminum X-ray depth of penetration: 1,000 – 3,000 nm (1-3 μ)
Due to variations in the flight path of each photoelectron within the surface and interactions with nearby atoms in the sample the number of electrons that escape from the surface is dependent on the characteristic “Inelastic Mean Free Path” (IMFP, λ) of the electron emitted due to the electronic state of the electron and its’ kinetic energy. For the first IMFP, the relative % of electrons that esca[e the surface into the vacuum is ~60%. For the second IMFP, the relative % of electrons that escape the surface into the vacuum is ~30%. For the third IMFP, ~8% escape.
The ISO definition for Information Depth (Depth of Information) is:
4.246
information depth
maximum depth, normal to the surface (4.458), from which useful information is obtained
Note 1 to entry: The information depths for the different surface analysis methods differ significantly. The
information depth for each technique depends on the material being analysed, the particular signals being
recorded from that material, and the instrument configuration.
Note 2 to entry: The information depth can be identified with the sample thickness from which a specified
percentage (e.g. 95% or 99%) of the detected signal originates.
Note 3 to entry: The information depth can be determined from a measured, calculated, or estimated emission depth distribution function (4.161) for the signal of interest.
XPS Depth of Information = 3 x IMFP (λ) of each Photoelectron
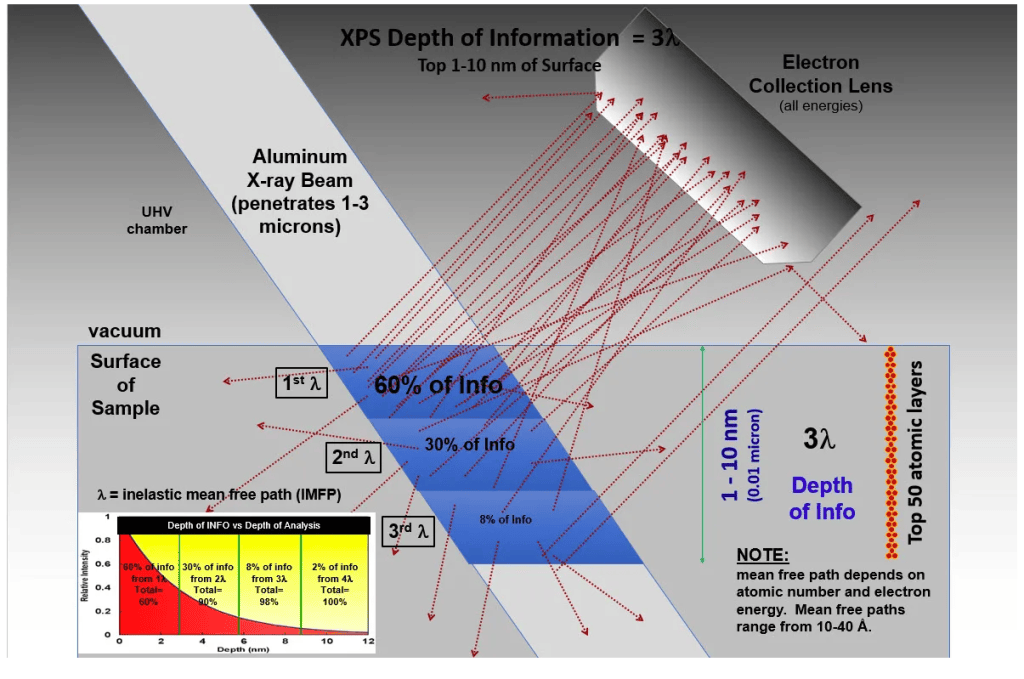
Depth of Information for XPS relative to EDS (SEM-EDS)
Elemental composition results from EDS survey spectra and XPS survey spectra are usually very different because XPS measures only the top 12 nm, while EDS measures 300 nm to 5,000 nm below the surface.
EDS is true Bulk Information. XPS is true Surface Information. SEM images are from the top 5-10 nm, but SEM images do not contain any chemical information.
XPS can be used to analyze true bulk of a sample by fracturing the sample to expose true bulk.
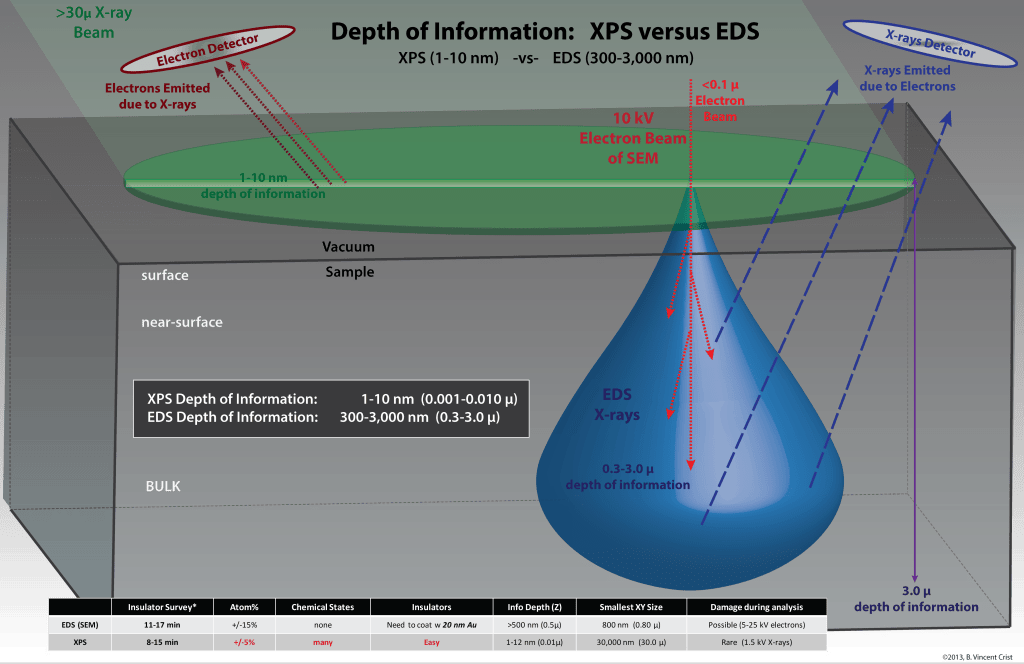
Smallest Analysis Areas and Depths of Information of similar Surface Chemical Analysis Techniques