Uncertainty
Uncertain Data is data that contains noise that makes it deviate from the correct, intended or original values.
What is uncertainty?
Many of our statistics rely on data collected from surveys. We are often interested in the characteristics of the population of people or businesses as a whole, but usually survey a sample of the population rather than everyone. This is timelier and more cost-effective and, if the sample is large enough and well designed, can lead to accurate statistics.
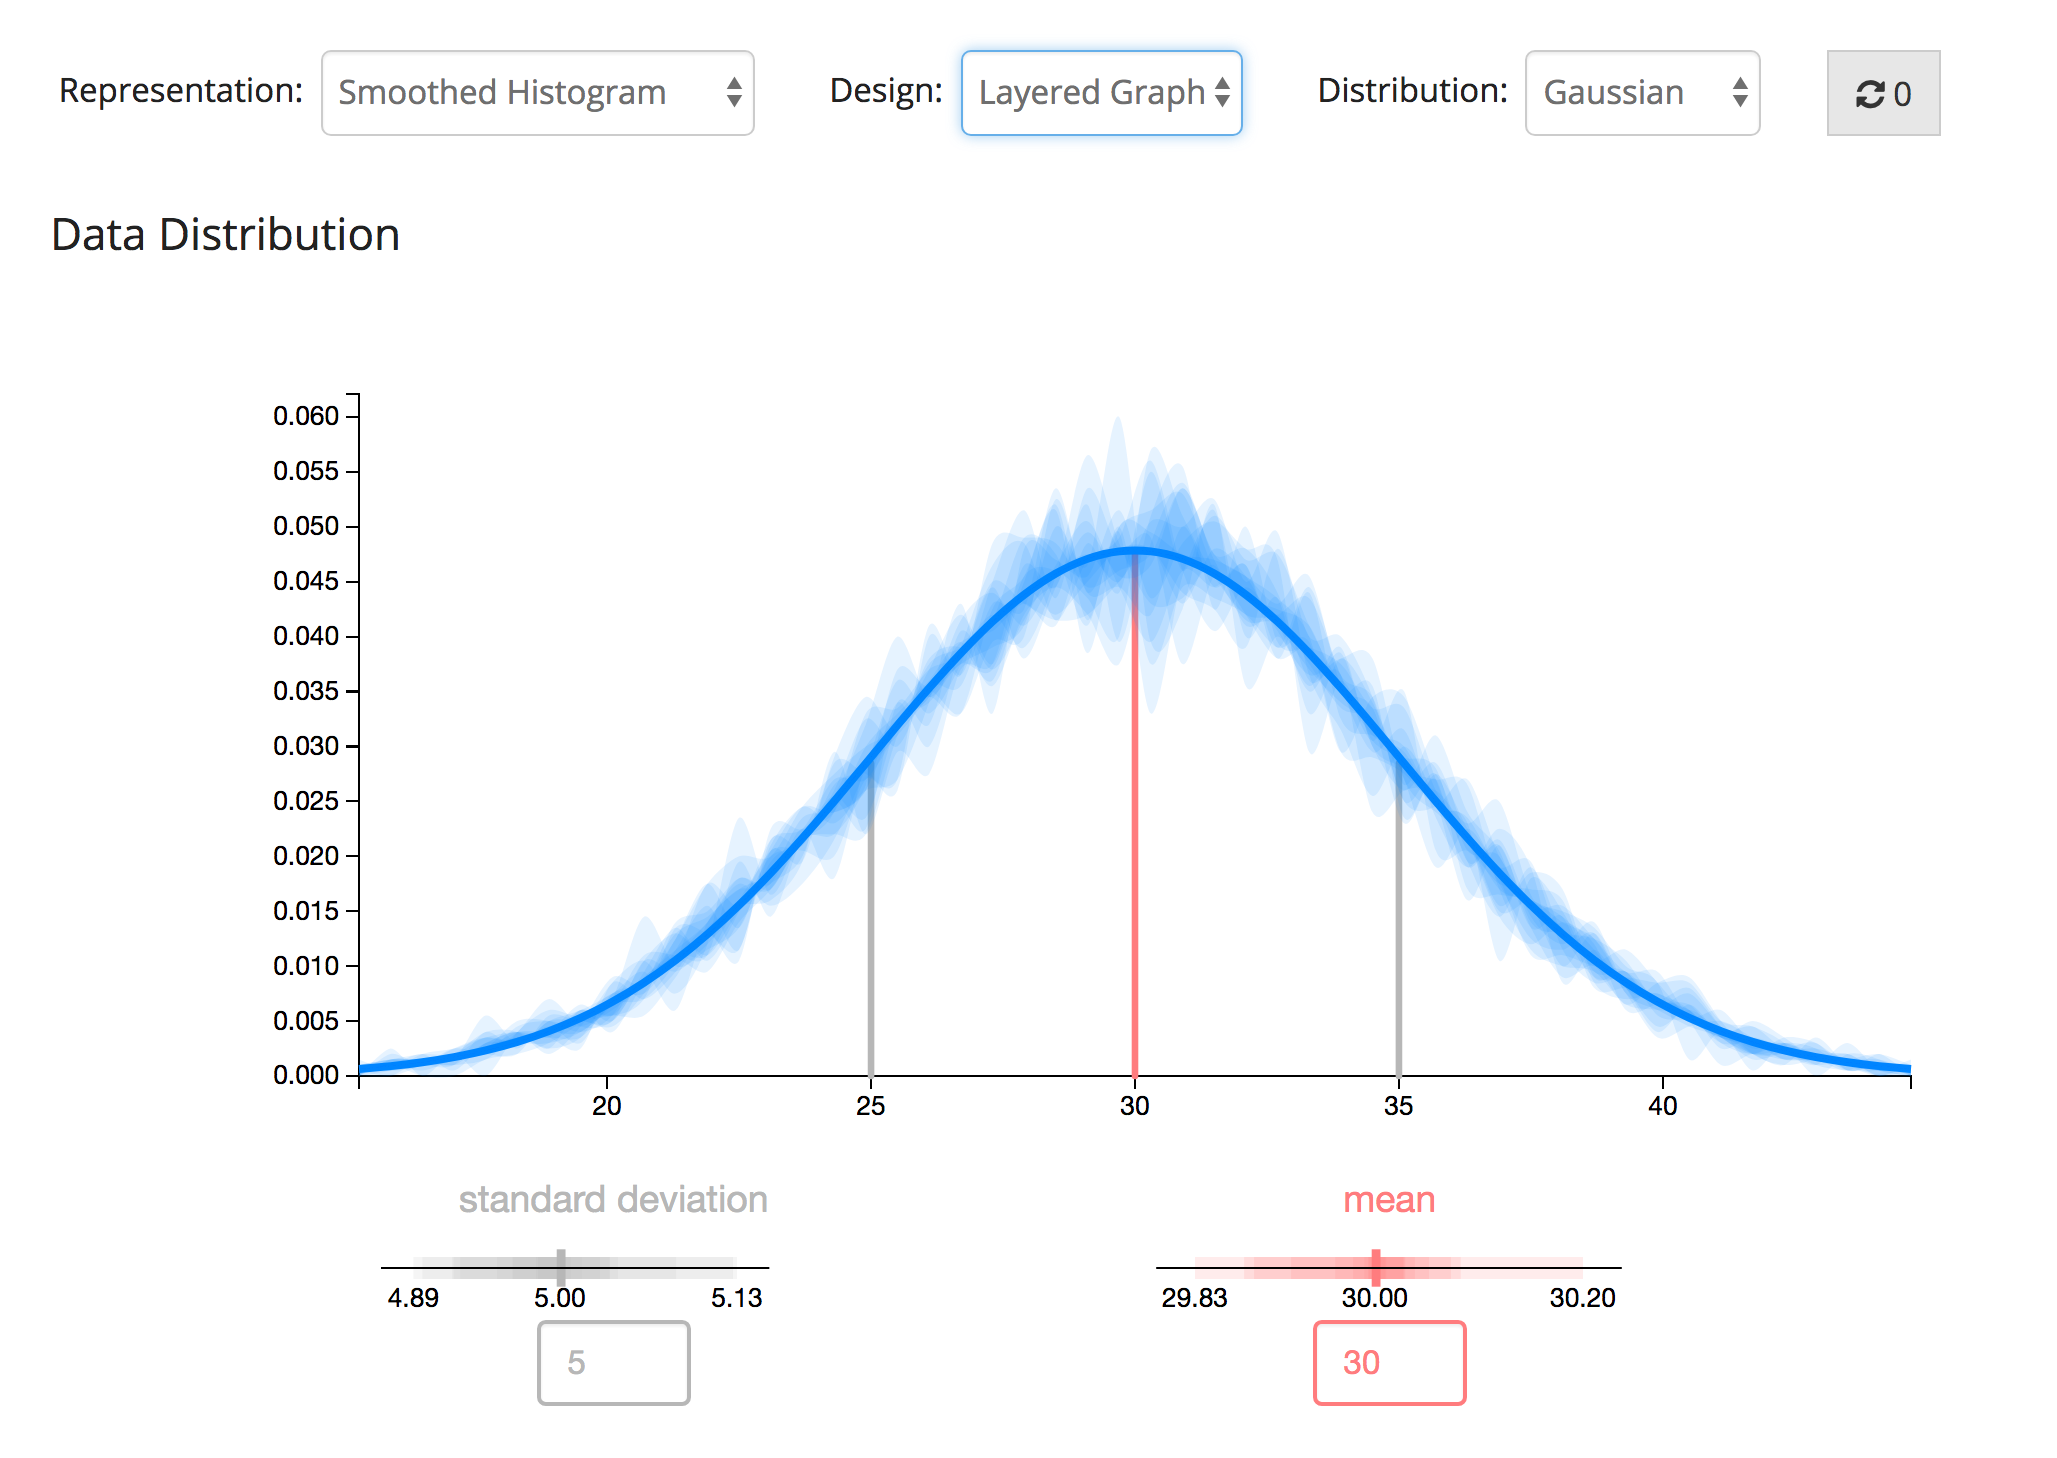
Using a sample means that our statistics are usually accompanied by measures of uncertainty. Uncertainty relates to how the estimate might differ from the “true value” and these measures help users of ONS statistics to understand the degree of confidence in the outputs. These measures of uncertainty include:
-
standard error
-
confidence interval
-
coefficient of variation
-
statistical significance
Understanding sampling and the effect it has on statistics is also important for interpreting these measures of uncertainty.