

Calibration (reference) energies, developed by an international team of XPS experts, were published in 2001 by the International Standards Organization (ISO) Technical Committee (TC/201) for Surface Chemical Analysis as ISO document #15472 (titled: Surface chemical analysis – X-ray photoelectron spectrometers – Calibration of energy scales). We hope that all XPS instruments around the world will use these Calibration (Reference) Energies which define the energy scale of all XPS instruments.
To produce these Calibration Energies, the service engineer adjusts the voltage settings inside the electronics of the XPS instrument are adjusted until the instrument produces high energy resolution, chemical state spectra from the Calibration Metals (Cu, Ag, Au) that produce the Calibration Binding Energies shown here. Each of these metals need to be cleaned by argon ion etching before measuring their spectra. These are the Calibration Binding Energies (BEs) that operators should measure whenever anyone thinks that the XPS instrument is not producing valid BEs from a sample, especially a conductive sample.
The ISO BE calibration energies for a Monochromatic Al k-alpha X-ray source are:
Cu (2p3/2), Cu (3p3/2), Ag (3d5/2) and Au (4f7/2) signals are:
932.62 eV, 75.13 eV, 368.21 eV and 83.96 eV, respectively.
These ISO values are reported with ±0.02 eV uncertainty, and they represent the first international effort to standardize the calibration energies used to calibrate the energy scales of XPS instruments worldwide.
In general, the enegy scale should remain stable for many months, but the operator should routinely check if the instrument is or is not operating correctly by measuring these signals and peak-fitting the spectra.
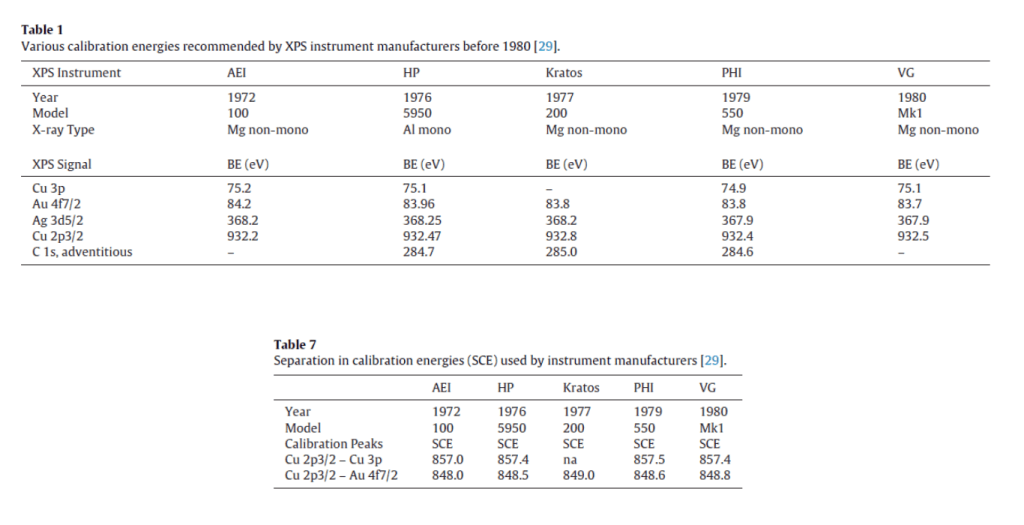
Table 1 shows the large variation in BE Calibration Energies that were previously promoted by many XPS instrument makers for many years. The large variation is BE Calibration Energies caused many scientists and researchers to publish BEs from research materials that can NOT be reproduced by other researchers or scientists because their instrument uses a different set of Calibration Energies that they do not know how to adjust.
These large variations caused large variations in the BEs published in the literature, many handbooks and the NIST SRD20 database. Table 7 shows the energy difference (SCE) between BEs from the sample element, Copper, for instruments produced and calibration by different manufacturers.
Today, in 2023, you will find in new literature publications, various Calibration BEs, which means that you must correct their BEs to match your Calibration BEs so that your Calibration BEs and their Calibration BEs are the same. You can find this problem in a journal dedicated to archiving XPS spectra: Journal of Surface Science Spectra (JVST). In that same journal you will find that the author (contributor) reported only 1 of the recommended Calibration BEs, and they do not report the date that they last checked or adjusted their binding energy scale. As a result, the uncertainties found in recent literature (2000 to 2020) are too often the same as the uncertainties found in the early literature (1970 to 2000). Improvements are happening, but you must exercise caution when using literature BEs to make chemical state assignments on your samples.
You should consider collecting your own BEs by analyzing “pure” reference chemical compounds that you will use to help you identify your chemical state species after you have properly cleaned the surface of your reference chemicals, freshly ground them, or cleaved them (in air) to expose fresh bulk.
Everyone needs to be careful when using literature BE values from insulators and conductors before 2010. We really need to make fresh BEs from pure chemical or pure materials that we use to identify the products from your processing. Conductors can have uncertainties as large as 0.4 eV, and insulators can have uncertainties as large as 1.0 to 1.3 eV.