

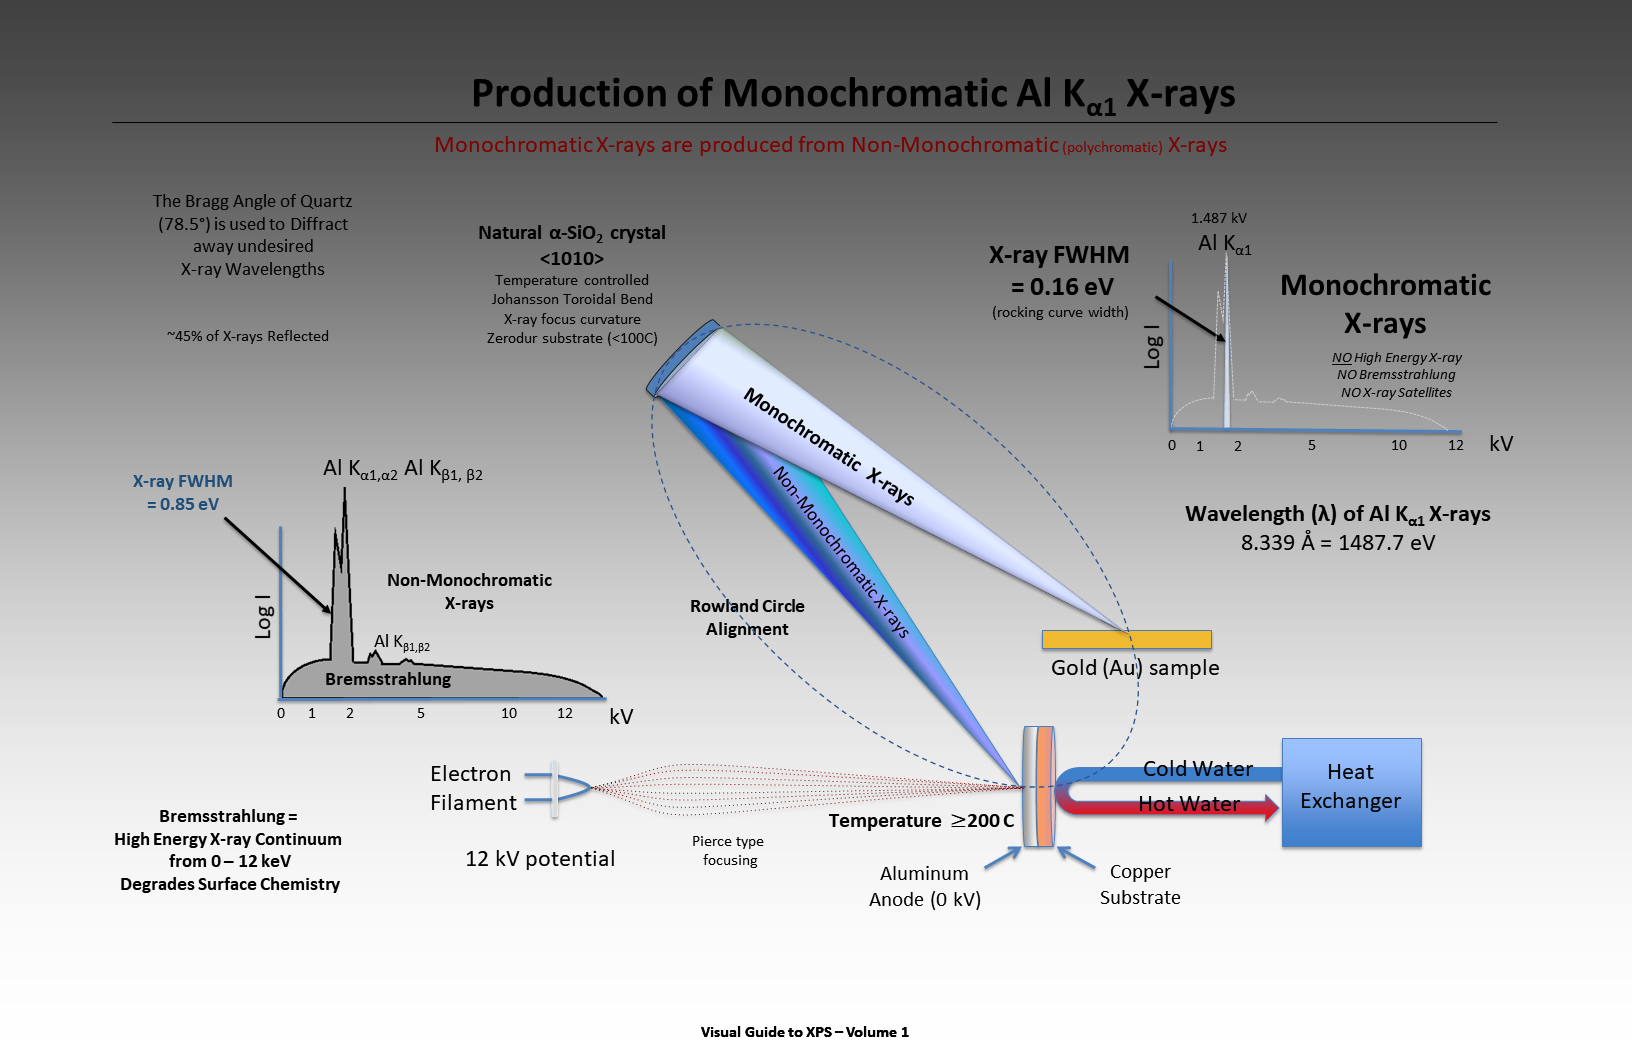
Monochromatic Aluminum X-rays are the de-facto standard source of X-rays used in modern XPS instruments. To produce monochromatic X-rays, the instrument first produces non-monochromatic X-rays that are diffracted at the Bragg angle from a thin slice of natural quartz crystal that is slightly bent in both X and Y axes to produce a focused beam of monochromatic X-rays. Select image to view expanded version.
The size of the beam when it strikes the sample can be varied from as small as 10 microns to as large as 1,000 microns in modern XPS instruments. The different beam sizes are used to analyze specific areas on the sample that are of interest such as a defect area or a contamination area that is only 300 microns in diameter. The X-ray beam size can be varied but the XPS Depth of Information is limited to the top 12 nm or less.
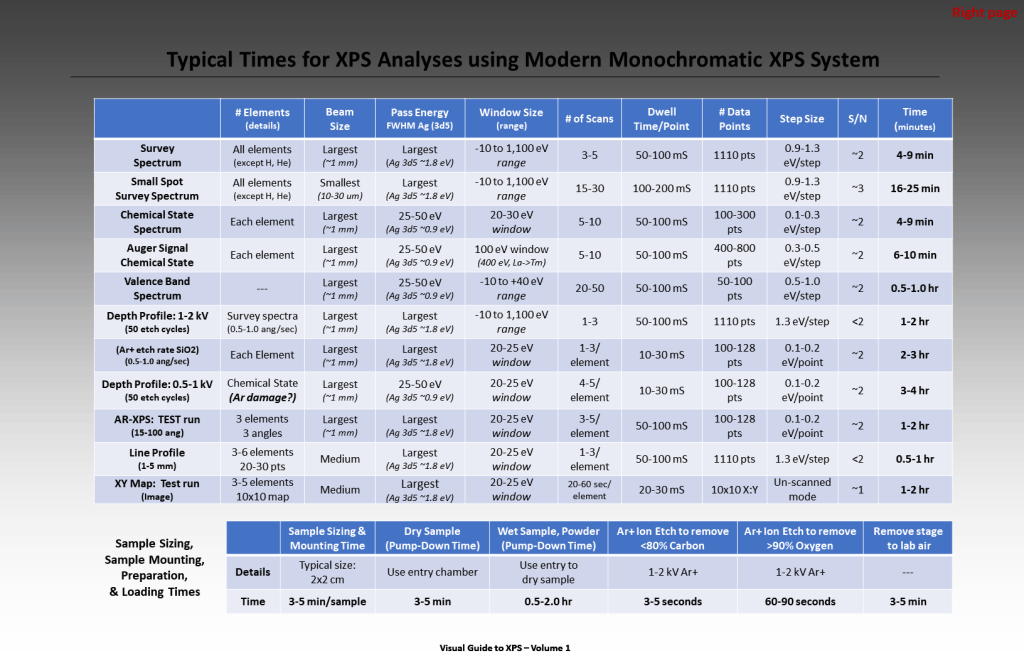
The largest beams produce the strongest electron count-rate signal. The smaller beam sizes have smaller and smaller count-rates which means that the operator may choose to collect more scans to produce spectra that have less noise which makes it easier to detect weaker signals.
After the operator has selected the desired X-ray beam size, they must turn on the charge neutralizer system (flood gun) if the sample is a non-conductive insulator or the sample is sitting on top of an insulator.
Several other data collection parameters (i.e. focus position, pass energy, dwell time, step size, number of data points, energy range, number of scans) must also be selected before the analysis can be started. The selection of those data collection parameters define what type of spectrum will be collected.
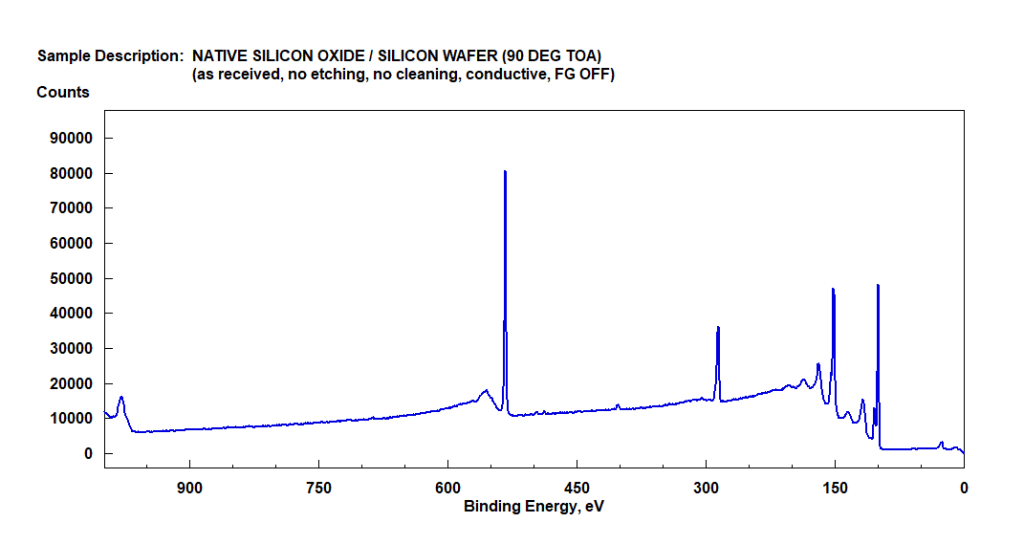
There are two basic types of spectra collected. They are “Survey Spectra” and “Chemical State Spectra”. Survey Spectra use data collection settings that produce large signals but have low energy resolution. Survey Spectra are designed to reveal the presence or absence of elements in the top 1-12 nm of the area being analyzed.
Survey Spectra are normally collected over a large energy range (e.g. 0 eV to 1100 eV, or at most 1400 eV). The XPS analyst must identify and label each of the major XPS peaks in a survey spectrum. After integrating the peak areas of the principal elements, the analyst produces an atom% compostion.
Chemical State Spectra use data collection settings that produce high energy resolution but have much weaker signals. Chemical State Spectra are designed to reveal the presence or absence of different, closely related chemical states for the element being analyzed. Due to the weakness of the signal, Chemical State Spectra are normally collected over a narrow energy range (e.g. 20 to 50 eV wide).
Chemical State Spectra require peak-fitting of the peak-envelop that produces a series of individual narrow peaks (0.5 to 1.5 eV) that belong to different chemical states of the element of interest. Each individual peak must be assigned to a specific chemical state species. The PHI handbook and the NIST database have BEs from chemical states published in many literature journals, but sadly the uncertainty in those BEs ranges from 0.4 eV for conductors to as much as 1.2 eV for insulators.
Example of Raw Survey Spectrum and Processed Survey Spectrum

Example of Raw Chemical State Spectrum and Processed Chemical State Spectrum


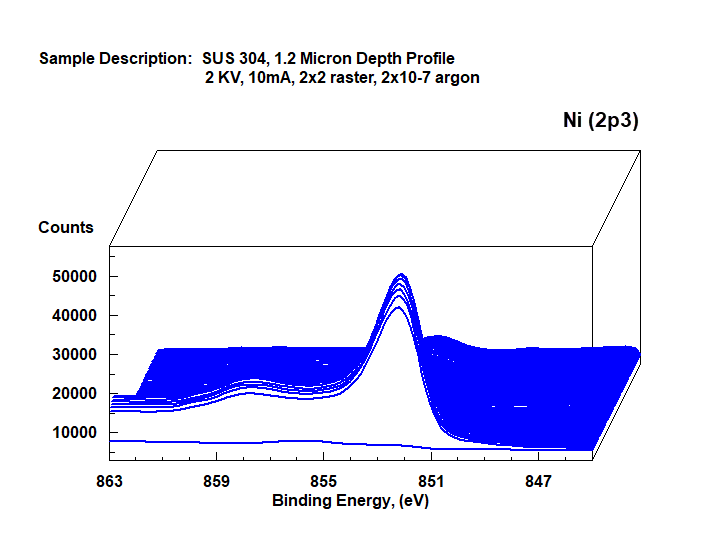
Example of Raw Depth Profile Plot and Processed Depth Profile Plot


Example of Raw Montage Plot from Depth Profile Data and Processed Plot
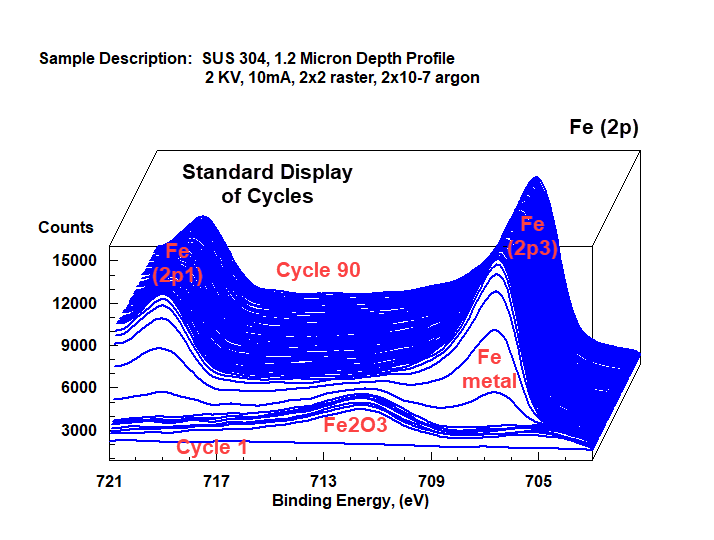
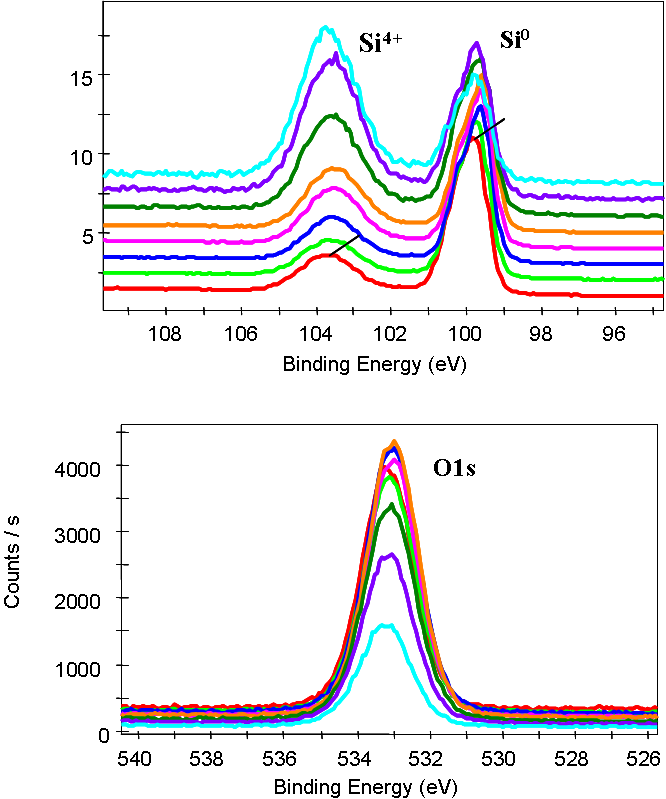
Example of Overlay of Raw Angle-Resolved XPS Spectra from Si (2p) and O (1s)
Example of Processed XY Map Covering a 500×900 micron area.
(note: SEM-EDX maps are from deep inside any sample: 0.5 to 2.0 microns)
