
XPS Basics
Advantages of XPS

Basic Physics of XPS
” X-rays IN – Electrons OUT “

XPS gives information (data) from the top 1-10 nm (0.01 um) of the surface of a solid sample.

A Schematic View of the Photoelectric Effect and the Photoelectrons that Escape into the Vacuum of the XPS Instrument
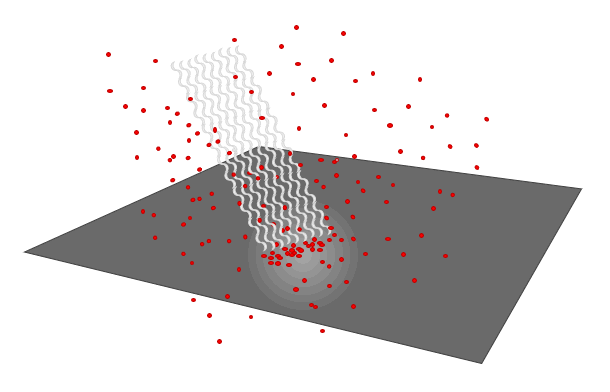
XPS uses the Photoelectric Effect

The Photoelectric Effect produces Photoelectrons

The Photoelectrons produce XPS Spectra

How are Monochromatic X-rays Produced?

Schematic View of XPS Instrument

Schematic View of XPS Instrument

Schematic View of Photo-emission Process

Standard Components of an XPS Instrument

Basic Physics of XPS

How do we Know Shape and Location of X-ray Beam

How do we Know Shape and Location of X-ray Beam

Depth of Information for XPS Data

How Instrument Actually Measures PhotoElectrons

BE versus Atomic Number

Detection Limits depend on Noise and Baseline Endpoint Averaging

Rough Detection Limit for XPS

XPS Detection Limits

Limits & Weaknesses

Data Collection Settings – Parameters & Variables
Typical Times and Experimental Variables to make Survey Spectra, Chemical State Spectra, Auger Signal Spectra, Valence Band Spectra and Others

Data Collection Settings – to make Survey Spectra
(Wide Scan, Low Energy Resolution, High Counts)

Data Collection Settings – to make Chemical State Spectra
(Narrow Scan, High Energy Resolution)

Data Collection Settings – to make Auger Signal Spectra

Common Difficulties
| Adsorbed gases (CO2, O2, H2O) |
| XPS after SEM |
| After baking |
| Anode induced ghost |
| Anode lifetime |
| Baking effects |
| Conductive tape |
| Conductive tape – not so conductive – insulating |
| Contamination spread |
| Data analysis |
| Data artefacts (ghost, spike, …) |
| Data processing |
| Depth profiling |
| Double side tape |
| Dropped sample |
| Electron gun lifetime |
| Filaments |
| Hardware problems |
| Hardware troubleshooting |
| Instrument baking |
| Instrument calibration |
| Ion beam degradation |
| Ion beam induced mixing |
| Leak checking |
| Leaks |
| Magnetic lens – effect on AR-XPS |
| Multi-technique surface analysis |
| Need beam alignment |
| Need column alignment |
| Need crystal alignment |
| Oxide buildup on lens – Au coat to solve |
| Peak overlaps – Al over Cu, Sb over O etc. |
| Peak overlaps – auger on XPS |
| Peak overlaps – non-mono satellites |
| Polymer to graphite after Ar+ etch |
| Potential breakage of mono crystals |
| Preferential sputtering |
| Scotch brand Invisible tape |
| SEM last – carbon buildup |
| Software troubleshooting |
| Surface migration |
| Tapes in vacuum |
| ToF-SIMS – after XPS |
| Virtual vacuum leaks |
Features “Anatomy” of Raw Survey Spectra
Topic #1: Why do we collect Survey Spectra?
Topic #2: What are the Features of a Raw Survey Spectrum?
Topic #3: How do we Identify each of the Peaks in a Survey Spectrum?
Topic #1: Why do we collect Survey Spectra? and When?
- A Survey Spectrum helps us to decide what to do with a sample:
- Can we analyze it as it is ?
- Should we ion etch the surface or replace the sample with a fresh sample?
- Can we analyze it as it is ?
- Two (2) Major Reasons to collect a Survey Spectrum. To learn:
- How much of each element is present in the top surface of the sample?
- Which elements are available to run Chemical State Spectra?
- Special Note: Normal XPS analyses can never detect the presence of Hydrogen because the signal is too small.
- Survey spectra are normally the first analyses to be run on any sample because we need to know:
- Which elements are present or absent on the area that was analyzed?
- The atom% of the major components because we are doing routine engineer comparisons?
- If we are analyzing the correct sample? Or did someone give us the wrong sample, or make the wrong coating, or Silicone is present!
- How dirty or contaminated is the area that was analyzed?
- From a Survey Spectrum we can also learn the following:
- How much Carbon and Oxygen is present, because every sample has C & O as surface contaminants. One angstrom of an element is ~one atom%.
- What elements are present or absent in the top 5-10 nm of the surface of the area that was analyzed?
- How much of each element is present ? Usually reported in Atom %s, but Weight % is often available.
- Sometimes see both metal and metal oxide forms of various metals even in a survey spectrum
- If we vertically expand the 0-600 eV region by 5-10X, we can often see trace level elements that are contaminants.
- Potential Degradation of Surface Chemistry during XPS Analysis due to X-rays, Vacuum or Flood gun?
- To learn if the surface chemistry is changing due to the analysis conditions, we often run a short survey spectrum at the start of an analysis run, and then again at the end of the analysis run.
- From a repeat survey spectrum, we can learn if the sample is losing a significant amount of an element due to analysis.
- From a repeat chemical state spectrum, we can learn if the ratio of different chemical states is changing due to analysis.
Topic #2: Features of Raw Survey Spectra
Experimental Results from XPS Analyses are plotted on X and Y axes to form a Spectrum
- X-Axis (horizontal) is the Binding Energy “BE” (eV) of Photo-electrons Analyzed
- Y-Axis (vertical) is the total number of Photo-electrons Counted (Cts) at each data point (channel)
| Raw Survey Spectrum of a Single Element (without Axis Labels) |
||
| Survey Spectrum of a Single Element
(Wide Scan Spectrum) |
 |
|
| Raw Survey Spectrum of a Single Element with Axis Values and Labels |
Raw Survey Spectrum of a Single Element
|
|
| Names of XY Axes | Raw Survey Spectrum of a Single Element |
|
| Typical Experimental Settings for a Survey Spectrum |
Typical Experimental Settings (Parameters) |
|
| Extrinsic Background Noise | Features of a Survey Spectrum
Extrinsic Background Noise
|
|
|
XPS Software Found and Integrated Four (4) Peaks |
||
| Four Peaks found by Automated Find Peaks Routine |  |
|
| Atom% and Peak Label Table |
“Atom% and Peak Label” Table of Peaks Found by XPS Software
|
|
| Survey spectrum with peaks integrated and labelled with BEs |
Survey Spectrum with Binding Energies (BEs) Labelled
|
|
| Table of XPS Binding Energies for all Elements – Listed in Atomic Number Order – used for manual identification of peaks |
Table of XPS Binding Energies used to Help Identify and Manually Label Peaks found by the Software or Operator Principal XPS Signals having strongest SF are Highlighted in Yellow This Table is used for Manually Identifying XPS Peaks
|
|
|
A Software Table that helps users to Identify and Label “Add Peak Labels (XPS Spectral Lines)” Table (Automated peak find and identify routines are provided by most software. The accuracy of identifying the peaks is 70-90%. |
||
| Add Peak Labels routine used to Identify Peaks in an XPS Spectrum |  |
|
|
A Survey Spectrum with all Peaks Identified, and Labelled After Most or All of the XPS Peaks are Identified This is a very easy example because there is only one element present, C. |
||
| Survey Spectrum fully Labelled and Identified, but without Atom% Table |  |
|
| Survey Spectrum fully Labelled and Identified, with Atom% Table included on Plot |
Fully Processed Survey Spectrum
|
|
|
What is the relation between Survey Spectra and
Large Pass Energies produce Strong XPS Peaks that have very
Small Pass Energies produce High Energy Resolution XPS Peaks that have Large Pass Energy Surveys are very useful for detecting XPS Signals from Any Element in the Surface. Small Pass Energy Chemical State Spectra are very useful for detecting different Chemical States for Each Element, but the XPS Signal is small by comparison so Chemical State Spectra take ~10X longer that a Survey to collect a useful XPS Signal. Very small FWHM produced by High Energy Resolution settings (small PE) allow us to Peak-fit Chemical State Spectra and resolve the presence or absence of Chemical States that belong to the same Element. This is the reason why we are willing to wait longer to collect chemical state spectra that use high energy resolution settings that produce weak signals but have very narrow, very useful FWHM.
Why do we collect Chemical State Spectra after we collect Survey Spectra? Surveys are useful for detecting what elements are present or absent. After we collect a Survey Spectrum, then we learn if the surface chemistry of the sample
Spectrum Insert – High Resolution Spectrum of C (1s) Signal
Overlay of a High Energy Resolution C (1s) spectrum onto a Survey Spectrum
|
||
|
Insert – High Resolution Spectrum of C Auger Signal |
||
| Insert – High Resolution Spectrum of Valence Band of Carbon Reveals Peak Structures of Carbon Valence Band Peaks  |
||
| Insert – High Resolution Spectrum of C (1s) Signal Reveals Energy Loss Plasmon due to C (1s) Signal  |


Electron Configuration – Atomic Orbitals


